- By: Mike LaLonde
- January 22, 2013
Meet Our Team? A Fun Test Using Google Analytics Event Tracking
If you’re using Google Analytics, you’re likely well-aware of how to find usability data regarding navigation and page activity on your website. Tracking page views takes care of itself, but what about when a user interacts with your website in a way that doesn’t navigate to a new page?
That’s where we start talking about event tracking. You can view Google’s complete event tracking guide for developers, which can get a little complicated for those not so technically inclined. The point is you can track user actions, such as clicks or hovers, to see how users are interacting on your page. For example, you can track video interaction as users hit “Play,” “Stop,” or “Pause,” or even add listeners to see how much of the video that user viewed.
When we launched our new website back in late November, our “Our Team” had some action events on it that we thought might be fun to turn into a bit of a contest. Today, we combined it with the “Our Agency” page, so it seemed the perfect time to report the results. You can view the our agency page here, or there’s a snapshot of the important section below.
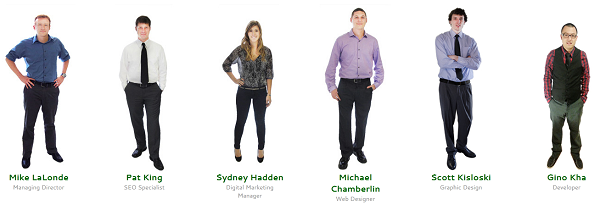
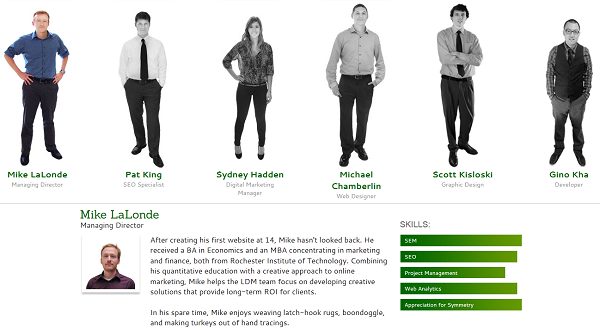
So there we are. And as the directions on the page say, if you click on our image, it expands so you can read our bio. It even turns everyone else to black and white. You can see what my expanded profile looks like below:
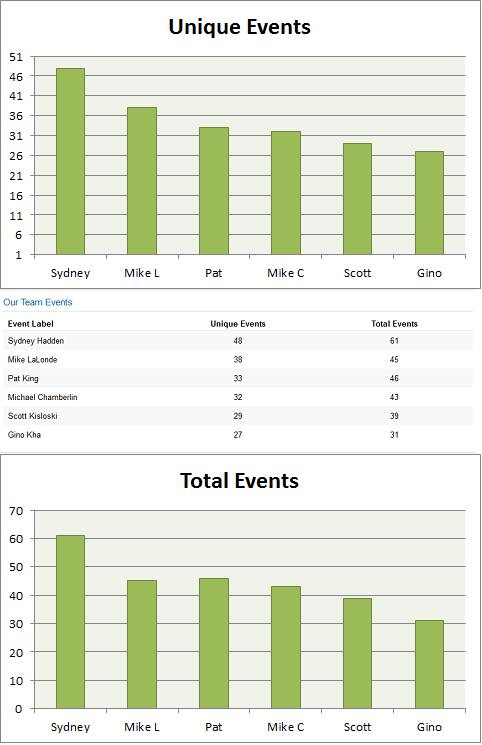
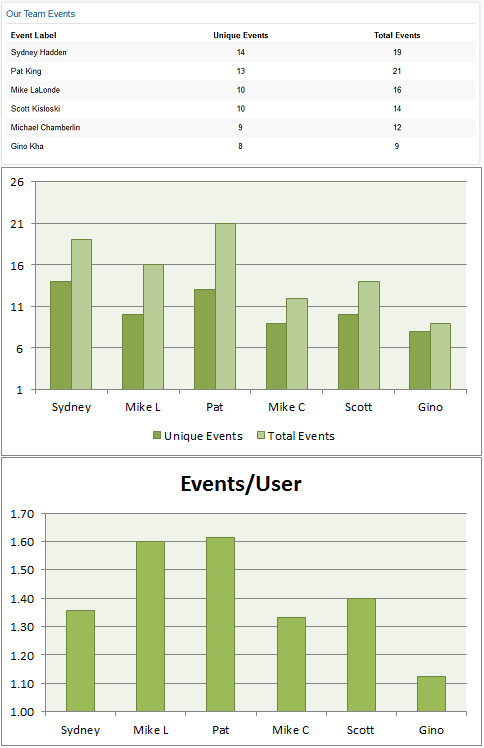
We’re a competitive bunch, so we had to make this interesting. So we decided to add some Google Analytics event tracking to each of us, so we knew how many times our profile was clicked on, and how many of those clicks were unique. Now it wouldn’t be quite fair for everyone to try go get the *most* clicks, because what would be the point of that. There’d be cheating and it would turn this into a pointless exercise. Instead, everyone here at LDM tried to rank each person in order from most unique clicks to fewest unique clicks. We’ll use the data from December 1 – January 21 for the purpose of the exercise.
I’m going to make this a little easier on you too. Scott finished 5th, and Gino finished 6th in total unique clicks. One of these 10 options is the correct of the rest of us, if you’d like to venture a guess as to the order:
Here’s a big picture of Mike as a clown to prevent you from accidentally scrolling down and seeing the results before voting.

Mike being Mike
Everyone here in the office was pretty close on the order, and Pat was the one who got it right. Nice job if you did too. That event chart is right from the custom Google Analytics dashboard – Google recently changed to feature those a lot more, so start playing around with them if you haven’t already (they’re pretty cool).
So, there’s the data. The question is, why do some people get more clicks than others? Unfortunately, without some additional randomizing and testing, it’s rather difficult to figure that out. We’re going to continue to use this page for some fun tests, so you can expect to see results from some follow-up performance testing soon.
But that doesn’t mean we can’t do a little analysis. For example, we can take a look at the average number of clicks per event. Or, in other words, how often to they click on a member of our team, and then come back and click on him/her again.
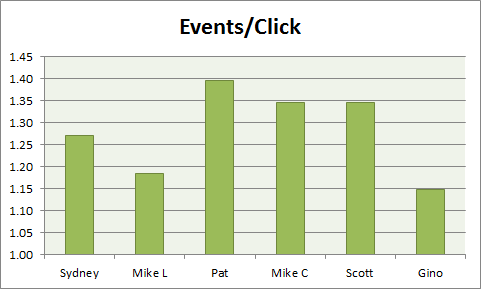
It seems if you have manager in your title, people really only want to see you once. Pat and the designers have a lot more repeat clicks than Sydney and I. Gino, suffering from sitting in the 6th spot and frequently cut off on smaller browsers, doesn’t really get much love from any segment.
How do you think the views on the “Our Team” page are affected if a visitor looks at our “SEO” page? Well, using Google Analytics advanced segments, we took a subset of our data to display click information only from users who accessed the SEO page on our website:
It certainly looks like this has an effect on our users interact on the “Our Team” page. I suppose Sydney still got the most clicks, but Pat, whose title is “SEO Specialist,” had a much better showing in this segment. Not only that, but after users looked through everyone on our team (which a lot of people do), they came back and looked at Pat’s profile again. As a matter of fact, over 60% of these visitors clicked on this profile twice.
I can also tell you that people that view a blog are more likely to click on that person’s profile on our “Our Team” page than they are to anyone else’s.
What if we look at usability data based on if a visitor viewed someone’s profile? Would that matter? Here’s the average amount of time people spent on our website (in minutes) if they viewed someone’s profile.
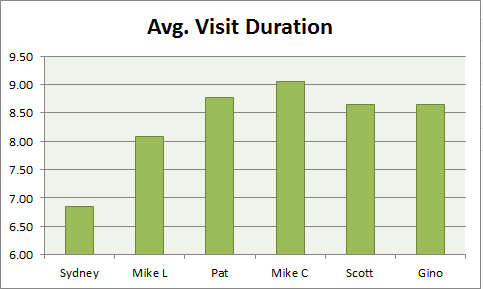
Visitors who viewed Sydney’s profile were quickly scared away from our site. This comes as no surprise to any of us.
Apparently, as soon as people take a look at Sydney’s profile, they like to bail. We don’t blame them. But feel free to interpret that data as you will.
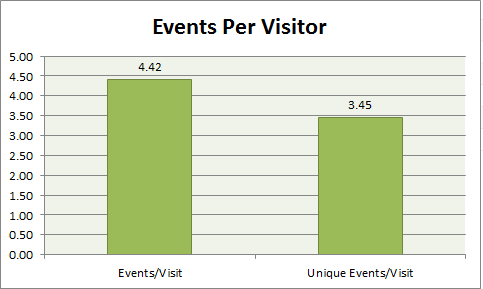
Lastly, I’ll leave you with Events per Visitor metrics. More accurately, it’s “Our Team events per visitor who viewed at least 1 team member” but that title was a bit verbose for my graph.
Segmenting using Google Analytics can provide us with a lot of information. And honestly, I love this stuff and could go through it all day, but unfortunately I can’t. We can see how profile views affect usability, how advanced segmenting and page views can affect how people research our company, and even how profile views (and events in general) can impact conversion events (which we don’t use, but in theory we certainly could).
But there are limitations. Viewing Analytics can recognize correlations. Running a/b and multivariate tests establishes causation.
With that in mind, we’re going to run some tests over the next few weeks to learn more about why people act the way they do when viewing our team. Is it extremely vital knowledge to running our business? No, it’s not. But it’s interesting to me, and I like trying to do interesting things. So, here are a few questions we can ask that might impact the results:
Does order matter? What if we randomize who shows up in each position?
Does appearance matter? What if we vary how “dressed up” each person is? Color of our shirts?
Do looks matter?
What if I grow a beard?
Does gender matter? (probably a tough one to a/b test)
Does how we’re standing matter?
So, those are a lot of questions, and we’ll likely pick our favorite couple and run a statistical test on them. What do you think is having the biggest impact on the click counts?